Machine Learning : Regression Models 📉📈

We’ve previously discussed the fundamentals of machine learning in a blog post. Now, let’s take a closer look at machine learning algorithms
Lineer Regression
The aim is to model the relationship between dependent and independent variables linearly.
y=b0+b1x1+b2x2+…+bnxn
- y represents the dependent variable.
- b0 =intercept
- b1-b2-bn = coefficients or weights

Finding Parameters and Weights
1Analytical Solution : Least Squares Method
Its primary goal is to find the best-fitting line or curve by minimizing the sum of the squares of the vertical deviations (residuals or errors) between the observed data points and the model’s predicted values.

2Optimization Solution: Gradient Descent
It iteratively updates the parameter value in the direction of the steepest descent, defined as the negative gradient, to find the parameter value that minimizes the corresponding function.
Simple Linear Regression Model
It aims to establish a linear relationship between a single independent variable and a dependent variable.
Y=β0+β1X
Multiple Linear Regression Model
This model assumes a linear relationship between the dependent variable and two or more independent variables.
Y=β0+β1X1+β2X2+⋯+βpXp
Logistic Regression
Logistic Regression is a statistical method used for binary classification problems. Despite its name containing “regression,” it’s a classification algorithm.
Actually, the output of logistic regression provides a continuous value. However, by using the sigmoid function, the output is transformed to fall between 0 and 1. Subsequently, by applying a classification threshold, the transformed values between 0 and 1 are assigned to their new classes based on the threshold value.
Performance Evaluation in Classification Problems

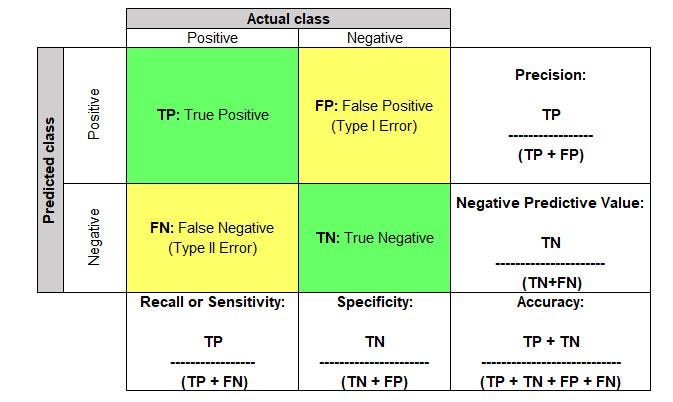
Confusion Matrix
The confusion matrix displays the comparison between actual and predicted classes and is used to evaluate the accuracy of a classification model.
ROC & AUC
The Receiver Operating Characteristic (ROC) curve is a graphical representation that illustrates the performance of a binary classification model across various threshold settings.
he Area Under the ROC Curve (AUC) is a single scalar value that represents the overall performance of the classification model. It quantifies the entire two-dimensional area under the ROC curve.
LOG LOSS
Log Loss measures the accuracy of a model’s predictions. The model predicts a probability value for each class. Log Loss is used to assess how accurate these predictions are

- N represents the number of observations.
- yi is the true class label (0 or 1).
- p(yi) is the predicted probability of belonging to the positive class.
K-Nearest Neighbors (KNN)
Predictions are made based on the similarities between observations. It can be used for regression and logistic problems. Using Euclidean or a similar distance calculation, distances are computed for each observation.
Big thanks to Vahit Keskin and Miuul
Contact me on Linkedin :) yaseminderyadilli
